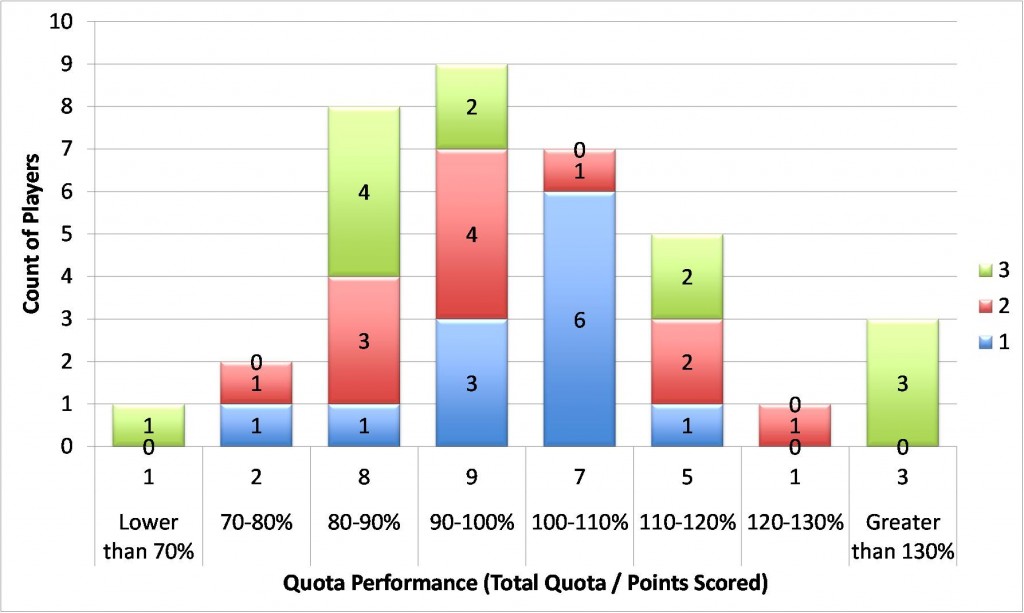
At the end of last year, I plotted out each players performance versus their quota. This was the result:
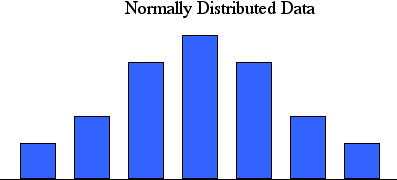
When you look at the graph, a majority of the league was between 80-120% of their quota. We had 3 “curve-killers” at over 130%. What we want the distribution to look like was this:
Ideally, you want golfers to hit 100% of their quota each and every week. There will be variations in performance week to week, but you don’t want large variations from the Quota via under or over performing.
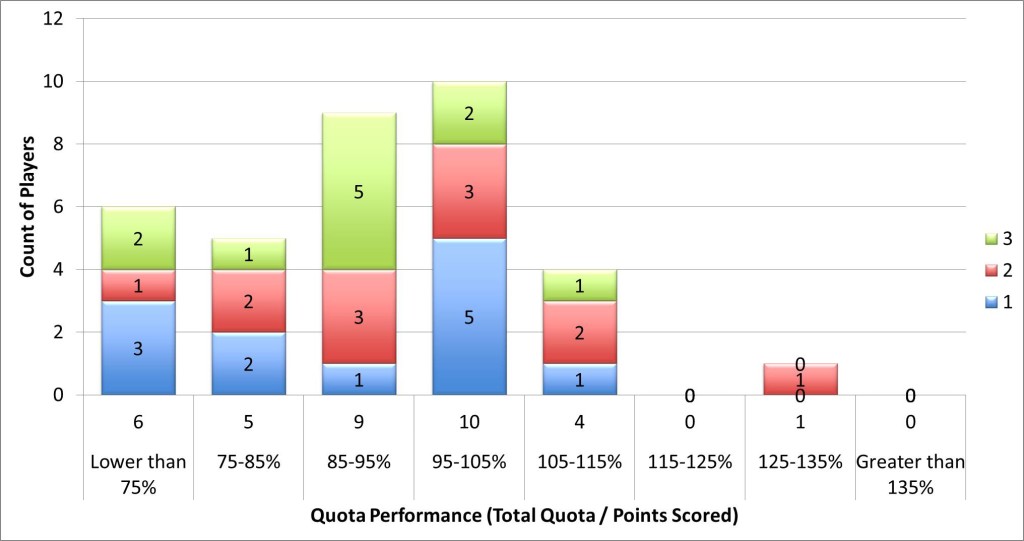
In an attempt to get a more normal distribution like the one above, we made some modifications to the scoring system. There was a specific point of emphasis to bring the outlying points (those at +130% Quota Performance) back into normal distribution. Here’s what the curve looks like so far this year:
Note the scale on the x-axis (the horizontal one for those who failed statistics) is modified. There is a significant amount of underperformance going on. I’d like to chalk that up to still shaking off the rust. As Quota’s move to better reflect play, I’d expect these numbers to be a tighter grouping. The good news is that there really isn’t a significant amount of overperformance. So who’s that curve-killer from Flight 2 in the 125%-135% range? It’s none other than the IT Nerd himself at 129.5%. That is likely to decrease as my Quota has risen from an 11 to start the year to a 15 heading into Week 6.
Here’s the full dataset behind these graphs
| Flight 1 | Total Quota | Total Points | Quota % | |
| Devin Carrigan | 66 | 43 | 65.2% | |
| Nick Wight | 73 | 68 | 93.2% | |
| Pat Donahue | 72 | 79 | 109.7% | |
| Connor Brown | 56 | 55 | 98.2% | |
| Dick Donegan | 65 | 65 | 100.0% | |
| TJ Donegan | 64 | 63 | 98.4% | |
| Jack Donegan | 24 | 16 | 66.7% | |
| Craig Hawkinson | 61 | 60 | 98.4% | |
| Steve Donegan | 60 | 60 | 100.0% | |
| Bill John | 36 | 25 | 69.4% | |
| DJ Mahar | 56 | 47 | 83.9% | |
| Vinny Procopio | 46 | 37 | 80.4% | |
| Flight 2 | Total Quota | Total Points | Quota % | |
| Drew Prucha | 36 | 34 | 94.4% | |
| Matt Lochner | 46 | 47 | 102.2% | |
| Mike Carroll | 61 | 79 | 129.5% | |
| Brian Thompson | 50 | 57 | 114.0% | |
| Dale Russell | 47 | 46 | 97.9% | |
| Marty Donegan | 46 | 45 | 97.8% | |
| Sean Mott | 53 | 60 | 113.2% | |
| Tony Massa | 38 | 22 | 57.9% | |
| Rick Fanto | 43 | 34 | 79.1% | |
| Chris Donegan | 46 | 38 | 82.6% | |
| Jon Carroll | 58 | 51 | 87.9% | |
| Tom Phillips | 53 | 46 | 86.8% | |
| Flight 3 | Total Quota | Total Points | Quota % | |
| Bob Zaleski | 21 | 22 | 104.8% | |
| Bob Moran | 26 | 12 | 46.2% | |
| Art Brillanti | 24 | 22 | 91.7% | |
| Jim Morgan | 27 | 24 | 88.9% | |
| Pat Cregg | 34 | 33 | 97.1% | |
| Joe Donegan | 34 | 30 | 88.2% | |
| Dan Mahar | 42 | 48 | 114.3% | |
| Denny Welch | 40 | 34 | 85.0% | |
| Tom Donegan | 37 | 24 | 64.9% | |
| Gary Antos | 24 | 21 | 87.5% | |
| Gary Thompson | 46 | 39 | 84.8% | |


