Week 4 Results

Standings have been updated, Week 4 results below.

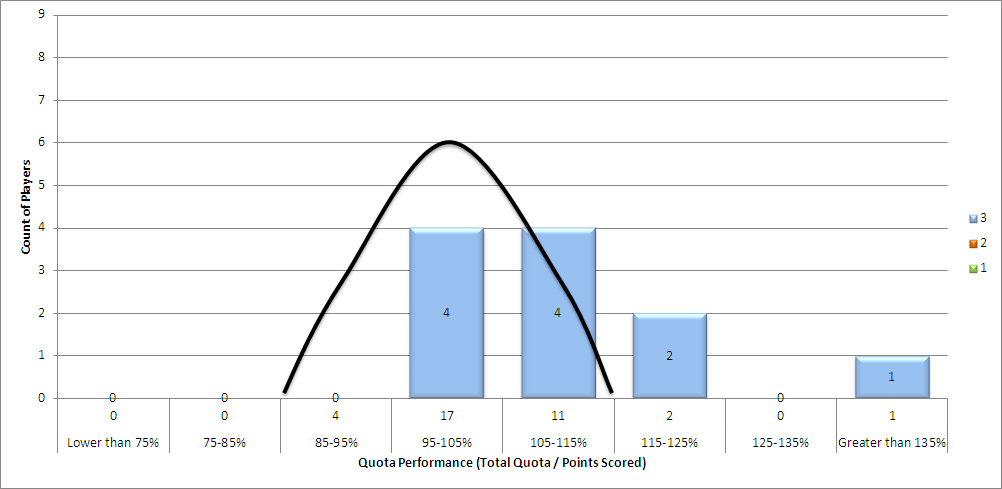
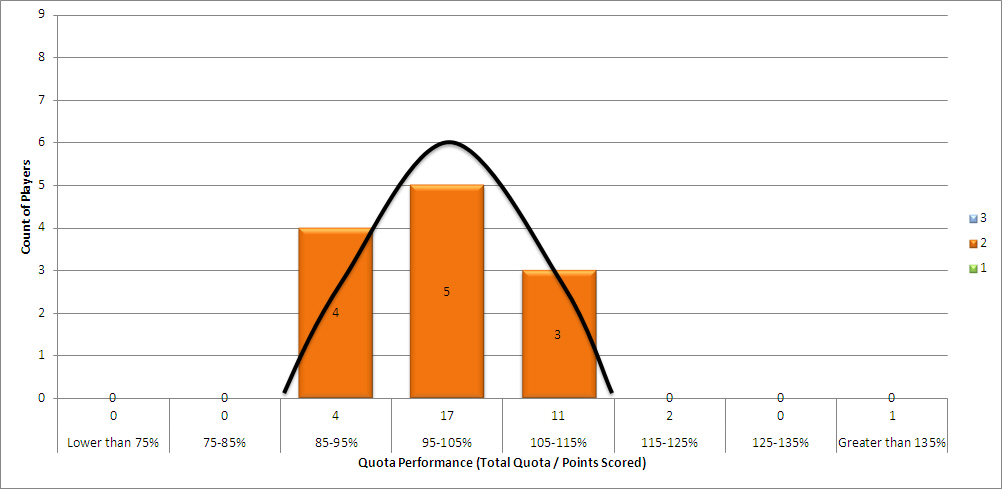
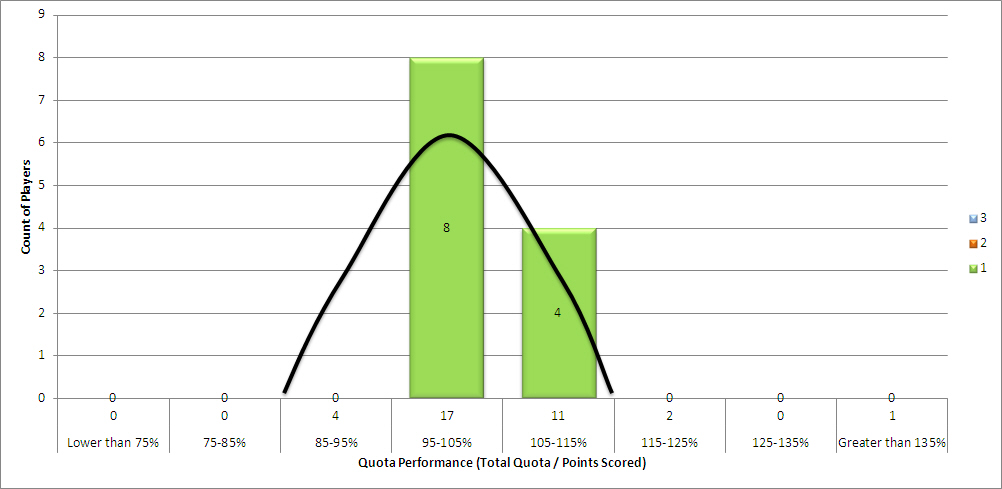
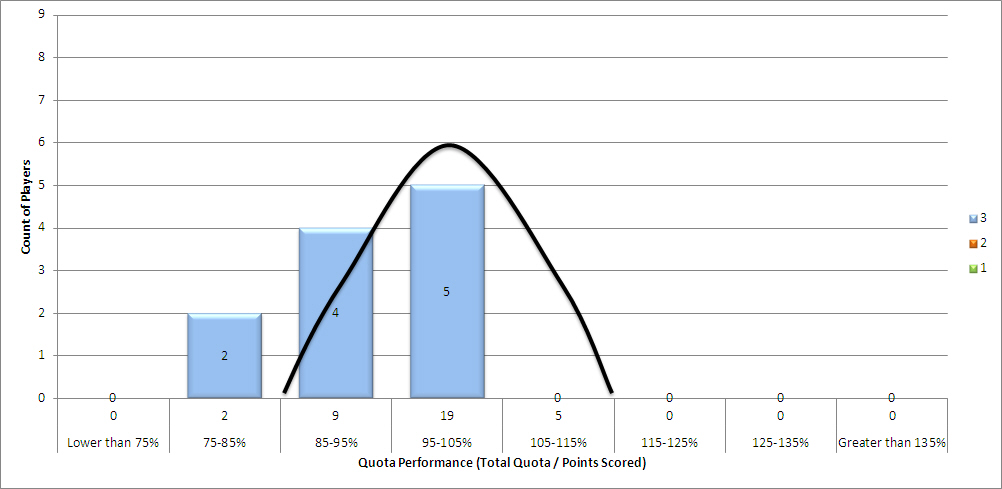
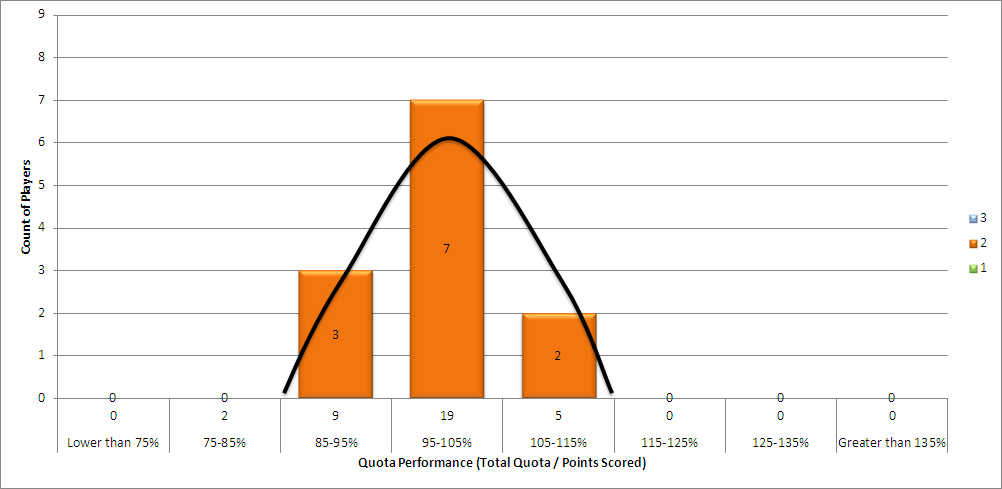
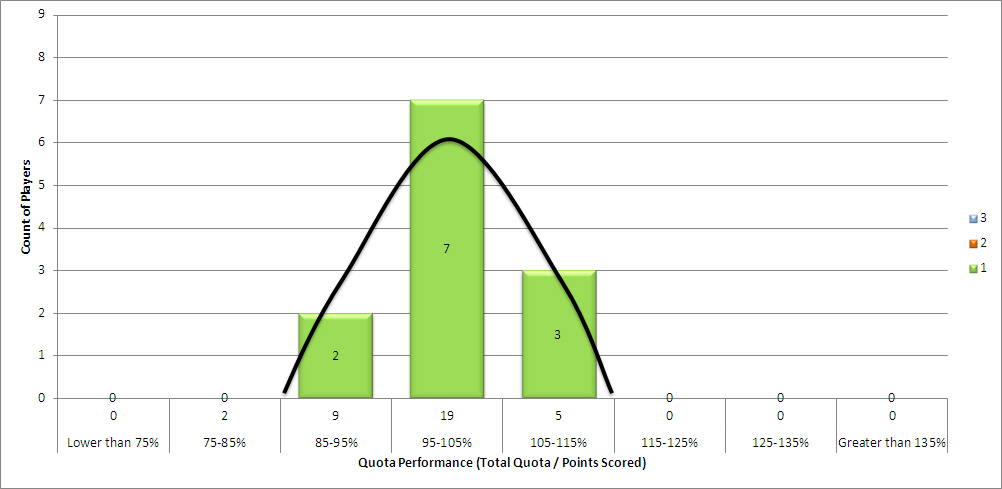
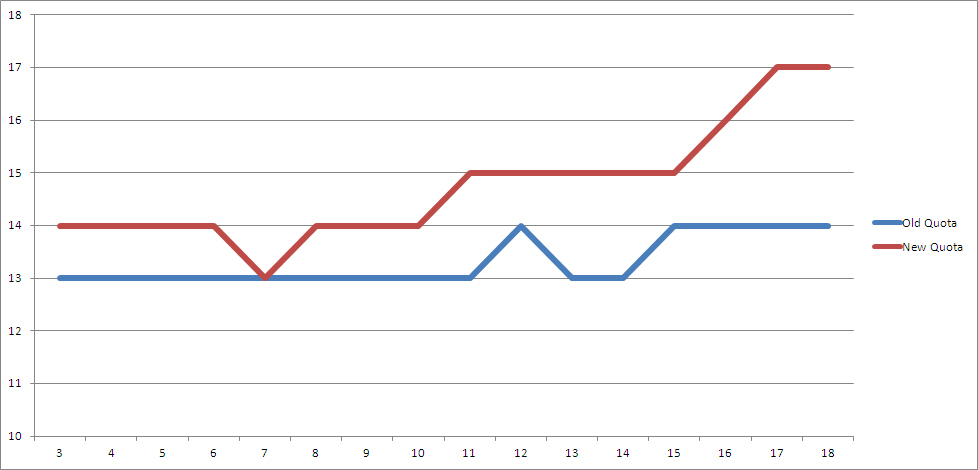
It’s the week we’ve all waited for…time for Quotas to move! Keep in mind that there is no limit on how much your quota can move. If you’re quota didn’t move, it may be because you have not registered four rounds or it’s right where you should be!

Week 5
Brian Thompson 12 VS 4 Bill Kirkby
Rick Fanto 8 VS 12 Connor Brown
Bob Zaleski 3 VS 11 Drew Prucha
Steve Donegan 10 VS 8 Tom Donegan
Jack Donegan 11 VS 12 Dick Donegan
Tony Massa 5 VS 8 Dan Mahar
Pat Donahue 14 VS 6 Bob Moran
Mike Burns 9 VS 14 Devin Carrigan
Art Brillanti 6 VS 9 Bill John
Jon Carroll 9 VS 7 Pat Cregg
Dale Russell 10 VS 12 Nick Wight
Gary Thompson 6 VS 9 Matt Lochner
Vinny Procopio 11 VS 6 Denny Welch
Chris Donegan 11 VS 12 TJ Donegan
Gary Antos 8 VS 12 Tom Phillips
Mike Carroll 10 VS 6 Joe Donegan
DJ Mahar 8 VS 13 Craig Hawkinson
Jim Morgan 8 VS 9 Marty Donegan


Flight 1 Flight 3
 Brian Thompson  $      –  Bob Zaleski  $              –
 Dick Donegan  PAR#11BIR#15  $     12  Tom Donegan  PAR#10PAR#17  $           18
 Steve Donegan  $      –  Tony Massa  $              –
 Craig Hawkinson  BIR#12  $       6  Joe Donegan  PAR#16  $             9
 Pat Donahue  BIR#13BIR#17  $     12  Art Brillanti  $              –
 Devin Carrigan  $      –  Bob Moran  $              –
 TJ Donegan  $      –  Denny Welch  $              –
 Jon Carroll  $      –  Gary Thompson  $              –
 Connor Brown  $      –  Bill Kirkby  $              –
 Vinny Procopio  $      –  Gary Antos  $              –
 Mike Carroll  BIR#18  $       6  Jim Morgan  PAR#14  $             9
 Nick Wight  $      –  Pat Cregg  $              –
 Flight 2
 Rick Fanto  $      –  Tom Phillips  $              –
 Dan Mahar  $      –  Dale Russell  $              –
 Jack Donegan  $      –  Drew Prucha  PAR#15  $           12
 Marty Donegan  BIR#13  $     12  Chris Donegan  $              –
 Mike Burns  PAR#11  $     12  DJ Mahar  $              –
 Bill John  $      –  Matt Lochner  $              –


Week 3 results

As always, check the Standings page for the updated standings. Lots of movement! Week 4 will be the last week that Quotas will remain at their initial values. Play starting Week 5 will have Quota movement!

Flight 1 Flight 3
 Brian Thompson  $      –  Bob Zaleski  $              –
 Dick Donegan  PAR#4  $       9  Tom Donegan  $              –
 Steve Donegan  $      –  Tony Massa  $              –
 Craig Hawkinson  $      –  Joe Donegan  $              –
 Pat Donahue  $      –  Art Brillanti  $              –
 Devin Carrigan  BIR#7  $       9  Bob Moran  $              –
 TJ Donegan  $      –  Denny Welch  PAR#1BOG#3  $           18
 Jon Carroll  $      –  Gary Thompson  PAR#5  $             9
 Connor Brown  PAR#9  $       9  Bill Kirkby  $              –
 Vinny Procopio  $      –  Gary Antos  PAR#6  $             9
 Mike Carroll  $      –  Jim Morgan  $              –
 Nick Wight  BIR#1  $       9  Pat Cregg  $              –
 Flight 2
 Rick Fanto  BIR#6  $     36  Tom Phillips  $              –
 Dan Mahar  $      –  Dale Russell  $              –
 Jack Donegan  $      –  Drew Prucha  $              –
 Marty Donegan  $      –  Chris Donegan  $              –
 Mike Burns  $      –  DJ Mahar  $              –
 Bill John  $      –  Matt Lochner  $              –


Week 4
Steve Donegan 12 VS 14 Pat Donahue
Jack Donegan 11 VS 8 Mike Burns
Tony Massa 9 VS 6 Art Brillanti
Nick Wight 13 VS 13 Dick Donegan
Matt Lochner 10 VS 8 Dan Mahar
Pat Cregg 7 VS 6 Tom Donegan
Jon Carroll 13 VS 13 Vinny Procopio
Dale Russell 10 VS 11 Chris Donegan
Gary Thompson 6 VS 8 Gary Antos
Connor Brown 17 VS 12 TJ Donegan
Drew Prucha 11 VS 12 Tom Phillips
Bill Kirkby 5 VS 7 Denny Welch
Brian Thompson 14 VS 12 Mike Carroll
Rick Fanto 10 VS 13 DJ Mahar
Bob Zaleski 6 VS 8 Jim Morgan
Devin Carrigan 17 VS 13 Craig Hawkinson
Bill John 12 VS 10 Marty Donegan
Bob Moran 6 VS 8 Joe Donegan


Wk 3 Hole 1 2 3 4 5 6 7 8 9 Gross Differential
Par 5 4 5 4 4 3 4 3 4
DJ Mahar 4 8 6 6 7 5 5 6 4 5 52.0 -9.0
Bill Kirkby 12 7 6 8 7 6 4 5 5 6 54.0 -3.0
Brian Thompson 3 6 5 7 7 4 2 5 3 5 44.0 -2.0
Dan Mahar 9 9 5 8 5 4 5 6 5 5 52.0 -3.0
Vinny Procopio 4 5 4 6 5 4 4 6 4 5 43.0 -2.0
Matt Lochner 7 5 4 6 5 4 4 4 4 5 41.0 3.0
Mike Carroll 5 7 4 6 6 5 4 5 2 5 44.0 -1.0
Drew Prucha 6 5 6 9 5 5 4 6 3 6 49.0 -4.0
Jon Carroll 4 8 6 8 6 4 4 5 4 5 50.0 -7.0
Marty Donegan 7 6 4 6 6 6 3 4 4 5 44.0 0.0
Gary Thompson 11 8 5 9 8 4 4 4 3 7 52.0 1.0
Craig Hawkinson 4 5 5 7 5 5 3 5 5 5 45.0 -4.0
Bob Zaleski 11 8 6 10 6 6 4 6 4 7 57.0 -5.0
Dick Donegan 4 8 6 7 4 5 4 5 3 5 47.0 -5.0
Art Brillanti 11 7 5 7 6 6 4 5 6 8 54.0 -5.0
TJ Donegan 5 5 4 7 5 4 4 5 2 6 42.0 1.0
Gary Antos 9 7 5 7 5 5 3 7 4 5 48.0 -1.0
Nick Wight 4 4 5 6 6 4 2 5 3 5 40.0 3.0
Rick Fanto 7 5 6 7 7 4 2 5 4 5 45.0 1.0
Tom Donegan 11 7 4 9 5 5 4 5 6 8 53.0 -2.0
Tony Massa 8 6 5 9 8 7 4 4 5 7 55.0 -5.0
Devin Carrigan 0 5 4 5 5 4 4 3 4 5 39.0 -1.0
Steve Donegan 5 6 4 8 8 5 3 4 2 7 47.0 -1.0
Bill John 5 7 6 7 5 5 5 6 4 7 52.0 -9.0
Chris Donegan 6 7 5 7 5 4 4 4 4 6 46.0 -3.0
John Mooney 9 5 6 7 6 5 4 6 5 4 48.0 -2.0
Dale Russell 7 6 5 8 5 4 4 6 3 6 47.0 -2.0
Joe Donegan 9 10 4 7 5 5 6 4 4 6 51.0 -3.0
Mike Burns 9 6 4 9 6 6 4 6 4 6 51.0 -3.0
Denny Welch 10 5 6 6 5 5 4 5 3 5 44.0 3.0
Jim Morgan 9 7 6 7 5 6 5 5 3 6 50.0 -4.0
Connor Brown 0 6 4 5 5 5 3 4 4 4 40.0 -3.0
Ryan Murphy 5 4 4 5 5 5 4 3 3 6 39.0 5.0
Tom Phillips 5 5 5 6 6 5 5 5 4 6 47.0 -5.0
Curt Smith 7 7 6 8 5 6 4 4 4 5 49.0 -4.0
Dave Hook 11 6 7 7 5 5 3 5 4 5 47.0 2.0


Player Quota Perf Pts Total Sub?
Brian Thompson -2 2 6
Rick Fanto 1 2
Bob Zaleski -5 1
Dick Donegan -5 1 1
Dan Mahar -3 0
Tom Donegan -2 0
Steve Donegan -1 2 2
Curt Smith -4 0 X
Tony Massa -5 0
Craig Hawkinson -4 0 3
Marty Donegan 0 2
Joe Donegan -3 0
Ryan Murphy 5 2 2 X
Mike Burns -3 0
Art Brillanti -5 0
Devin Carrigan -1 2 5
Bill John -9 0
Dave Hook 2 2 X
TJ Donegan 1 2 5
Tom Phillips -5 0
Denny Welch 3 2
Jon Carroll -7 0 4
Dale Russell -2 2
Gary Thompson 1 2
Connor Brown -3 2 5
Drew Prucha -4 0
Bill Kirkby -3 2
Vinny Procopio -2 0 0
Chris Donegan -3 0
Gary Antos -1 0
Mike Carroll -1 2 2
DJ Mahar -9 0
Jim Morgan -4 0
Nick Wight 3 2 7
Matt Lochner 3 2
John Mooney -2 2 X

Week 2 Results

Week 2 results below. Week 3 will also be our first Cross-Flight week. Be sure to check the Standings Page for the latest.

Flight 1 Flight 3
 Brian Thompson  $      –  Bob Zaleski  $              –
 Dick Donegan  $      –  Tom Donegan  $              –
 Steve Donegan  EAG#17  $       7  Tony Massa  PAR#11  $           12
 Craig Hawkinson  $      –  Joe Donegan  $              –
 Pat Donahue  BIR#11  $       7  Art Brillanti  $              –
 Devin Carrigan  BIR#14  $       7  Bob Moran  $              –
 TJ Donegan  BIR#13  $       7  Denny Welch  $              –
 Jon Carroll  $      –  Gary Thompson  $              –
 Connor Brown  PAR#15  $       7  Bill Kirkby  $              –
 Vinny Procopio  $      –  Gary Antos  $              –
 Mike Carroll  $      –  Jim Morgan  PAR#12BIR#16  $           24
 Nick Wight  $      –  Pat Cregg  $              –
 Flight 2
 Rick Fanto  $      –  Tom Phillips  $              –
 Dan Mahar  $      –  Dale Russell  $              –
 Jack Donegan  $      –  Drew Prucha  $              –
 Marty Donegan  $      –  Chris Donegan  $              –
 Mike Burns  $      –  DJ Mahar  $              –
 Bill John  BIR#16  $     36  Matt Lochner  $              –


Week 3
Rick Fanto 10 VS 6 Tom Donegan
Brian Thompson 14 VS 8 Dan Mahar
Bob Zaleski 6 VS 13 Dick Donegan
Jack Donegan 11 VS 6 Bob Moran
Steve Donegan 12 VS 12 Bill John
Tony Massa 9 VS 17 Devin Carrigan
Mike Burns 8 VS 7 Denny Welch
Pat Donahue 14 VS 12 Tom Phillips
Art Brillanti 6 VS 12 TJ Donegan
Dale Russell 10 VS 8 Joe Donegan
Jon Carroll 13 VS 10 Marty Donegan
Gary Thompson 6 VS 13 Craig Hawkinson
Chris Donegan 11 VS 7 Pat Cregg
Vinny Procopio 13 VS 10 Matt Lochner
Gary Antos 8 VS 13 Nick Wight
DJ Mahar 13 VS 5 Bill Kirkby
Mike Carroll 12 VS 11 Drew Prucha
Jim Morgan 8 VS 17 Connor Brown


Wk 2 Hole 10 11 12 13 14 15 16 17 18 Diff Pts
Par 4 4 5 4 3 4 3 4 5
Jim Morgan 9 6 7 5 6 3 5 2 4 5 43.0 5.0 2
Pat Cregg 10 6 6 7 5 4 5 6 5 6 50.0 -3.0 0
DJ Mahar 4 5 4 6 6 3 5 4 4 5 42.0 -1.0 2
Matt Lochner 7 6 5 6 4 6 5 5 6 5 48.0 -4.0 0
Rick Fanto 7 6 4 6 4 4 6 5 4 7 46.0 -2.0 0
Dan Mahar 9 7 6 8 5 4 5 4 4 6 49.0 -1.0 2
Denny Welch 10 7 8 6 6 4 6 5 5 7 54.0 -5.0 0
Mike Corbett 6 3 5 6 4 3 5 3 6 5 40.0 4.0 2
TJ Donegan 5 4 6 6 3 4 5 3 5 6 42.0 1.0 2
Jon Carroll 4 4 6 5 7 4 5 4 6 6 47.0 -5.0 0
Mike Shanahan 8 8 6 5 3 4 5 4 4 7 46.0 1.0 2
Jason Driscoll 8 8 6 6 6 4 6 4 7 5 52.0 -5.0 0
Drew Prucha 6 7 5 6 5 3 5 5 4 5 45.0 -1.0 1
Chris Donegan 6 4 5 6 6 3 5 4 5 6 44.0 -1.0 1
Bob Zaleski 11 6 8 7 5 3 6 4 6 7 52.0 -3.0 0
Tom Donegan 11 4 7 7 5 5 6 6 4 6 50.0 -1.0 2
Mike Burns 9 5 5 5 5 4 6 3 5 5 43.0 3.0 1
Bill John 5 5 4 5 5 4 5 2 5 5 40.0 3.0 1
Tony Massa 8 7 4 6 5 4 5 3 5 8 47.0 0.0 2
Joe Donegan 9 4 6 8 5 4 5 5 5 8 50.0 -2.0 0
Pat Donahue 3 5 3 5 4 3 6 4 4 7 41.0 0.0 1
Devin Carrigan 0 5 5 5 5 2 5 3 3 6 39.0 0.0 1
Steve Burt 7 7 4 7 6 4 4 4 5 5 46.0 -1.0 1
Marty Donegan 7 4 7 6 5 4 5 5 5 5 46.0 -1.0 1
Bill Kirkby 12 8 6 7 6 4 6 5 6 5 53.0 -3.0 0
John Mooney 8 4 7 6 4 3 5 5 5 9 48.0 0.0 2
Brian Thompson 3 4 5 5 5 4 5 3 5 5 41.0 -1.0 1
Dick Donegan 4 3 4 7 5 4 5 4 4 7 43.0 -1.0 1
Steve Donegan 5 5 6 8 4 3 5 5 2 4 42.0 4.0 2
Craig Hawkinson 4 4 6 6 5 4 6 3 5 4 43.0 -1.0 0
Mike Carroll 5 3 6 5 4 5 5 3 6 7 44.0 -1.0 0
Nick Wight 4 4 5 5 5 3 5 3 5 5 40.0 1.0 2
Connor Brown 0 5 6 7 4 3 4 3 6 5 43.0 -6.0 0
Vinny Procopio 4 6 5 5 4 3 5 4 4 5 41.0 0.0 2
Ryan Murphy 5 5 4 5 4 3 5 4 4 10 44.0 0.0 1
Dale Russell 7 8 4 6 4 3 5 5 5 5 45.0 0.0 1


Team Player Quota Perf Pts Total
1 Brian Thompson -1 1 1
Rick Fanto -2 0
Bob Zaleski -3 0
2 Dick Donegan -1 1 6
Dan Mahar -1 2
Tom Donegan -1 2
3 Steve Donegan 4 2 6
Steve Burt -1 1
Tony Massa 0 2
4 Craig Hawkinson -1 0 1
Marty Donegan -1 1
Joe Donegan -2 0
5 Pat Donahue 0 1 2
Mike Burns 3 1
Jason Driscoll -5 0
6 Devin Carrigan 0 1 5
Bill John 3 1
Mike Shanahan 1 2
7 TJ Donegan 1 2 3
Ryan Murphy 0 1
Denny Welch -5 0
8 Jon Carroll -5 0 4
Dale Russell 0 1
Mike Corbett 4 2
9 Connor Brown -6 0 1
Drew Prucha -1 1
Bill Kirkby -3 0
10 Vinny Procopio 0 2 6
Chris Donegan -1 1
John Mooney 0 2
11 Mike Carroll -1 0 5
DJ Mahar -1 2
Jim Morgan 5 2
12 Nick Wight 1 2 2
Matt Lochner -4 0
Pat Cregg -3 0

2016 Week 1

Before posting the scores, a few quick things for the league to be aware of.

  1. With the addition of Senior Tees being an option for those 65 and over, any player meeting the requirement must declare at the start of the season which tees they will be playing from. With only two members currently meeting the requirement, both Tom Donegan and Jack Donegan will be playing the 2016 season from the Senior Tees.
  2. The new mini-contest for the league will be a revised Super 18. I’ll post the Super 18 holes on the 2016 Standings Page. Here’s how it works:
    1. Each week, only one hole will be open to have a score registered to it. In Week 1, it was Hole #1 (which no one birdied!). In Week 2, it will be Hole #10. Week 3, Hole #2 and so on…
    2. We will use the Quota Scoring system to log your score for the hole. So if you par the Super 18 hole, you get 2 points towards the contest
    3. If you miss a week, we will take your score for a particular hole the next time you play that side.
    4. If you miss Week 17 or 18, we’ll take your score from the previous round on that particular side.


Week 2
Brian Thompson 14 VS 13 Dick Donegan
Rick Fanto 10 VS 8 Dan Mahar
Bob Zaleski 6 VS 6 Tom Donegan
Steve Donegan 12 VS 13 Craig Hawkinson
Jack Donegan 11 VS 10 Marty Donegan
Tony Massa 9 VS 8 Joe Donegan
Pat Donahue 14 VS 17 Devin Carrigan
Mike Burns 8 VS 12 Bill John
Art Brillanti 6 VS 6 Bob Moran
TJ Donegan 12 VS 13 Jon Carroll
Tom Phillips 12 VS 10 Dale Russell
Denny Welch 7 VS 6 Gary Thompson
Connor Brown 17 VS 13 Vinny Procopio
Drew Prucha 11 VS 11 Chris Donegan
Bill Kirkby 5 VS 8 Gary Antos
Mike Carroll 12 VS 13 Nick Wight
DJ Mahar 13 VS 10 Matt Lochner
Jim Morgan 8 VS 7 Pat Cregg


Flight 1 Flight 3
 Brian Thompson  BIR#4BIR#8  $     18  Bob Zaleski  $              –
 Dick Donegan  PAR#9  $       9  Tom Donegan  BIR#5  $           12
 Steve Donegan  $      –  Tony Massa  $              –
 Craig Hawkinson  $      –  Joe Donegan  $              –
 Pat Donahue  $      –  Art Brillanti  $              –
 Devin Carrigan  $      –  Bob Moran  $              –
 TJ Donegan  BIR#5  $       9  Denny Welch  $              –
 Jon Carroll  $      –  Gary Thompson  BOG#3  $           12
 Connor Brown  $      –  Bill Kirkby  $              –
 Vinny Procopio  $      –  Gary Antos  PAR#9  $           12
 Mike Carroll  $      –  Jim Morgan  $              –
 Nick Wight  $      –  Pat Cregg  $              –
 Flight 2
 Rick Fanto  $      –  Tom Phillips  $              –
 Dan Mahar  PAR#5  $     12  Dale Russell  PAR#3  $           12
 Jack Donegan  $      –  Drew Prucha  $              –
 Marty Donegan  $      –  Chris Donegan  PAR#4  $           12
 Mike Burns  $      –  DJ Mahar  $              –
 Bill John  $      –  Matt Lochner  $              –


Wk 1 Hole 1 2 3 4 5 6 7 8 9 Gross Differential Pts
Par 5 4 5 4 4 3 4 3 4
Gary Antos 9 7 5 7 5 6 3 6 4 4 47.0 -1.0 0
Jim Morgan 9 6 5 8 5 5 4 5 3 7 48.0 0.0 2
Rick Fanto 7 6 5 7 5 5 4 4 5 6 47.0 -3.0 2
Matt Lochner 7 6 5 7 5 8 4 6 4 5 50.0 -5.0 0
Chris Donegan 6 6 4 6 4 5 3 7 4 6 45.0 -1.0 2
DJ Mahar 4 6 6 7 5 5 5 3 3 5 45.0 -3.0 0
Tom Donegan 11 7 5 7 5 3 5 5 4 5 46.0 3.0 2
Tony Massa 8 5 6 10 4 5 4 5 4 7 50.0 -2.0 0
Bob Zaleski 11 6 6 8 6 5 4 4 3 5 47.0 2.0 2
Pat Cregg 10 5 6 7 7 4 5 4 3 6 47.0 1.0 0
Vinny Procopio 4 5 5 7 5 4 5 5 3 5 44.0 -3.0 0
Mike Carroll 5 5 6 6 4 5 2 4 4 6 42.0 1.0 2
Dan Mahar 9 7 4 7 6 4 3 6 4 5 46.0 0.0 2
John Mooney 6 6 6 7 5 5 4 6 6 7 52.0 -8.0 0
Brian Thompson 3 5 4 7 3 4 4 5 2 5 39.0 3.0 2
Nick Wight 4 6 6 7 7 5 3 4 4 6 48.0 -6.0 0
Bill Kirkby 12 5 7 8 7 6 3 6 5 6 53.0 -1.0 0
Gary Thompson 11 6 5 6 4 4 5 5 3 7 45.0 4.0 2
Dick Donegan 4 6 5 7 4 5 2 4 3 4 40.0 2.0 2
Steve Donegan 5 5 4 7 5 5 3 7 4 5 45.0 -2.0 0
Tom Phillips 5 7 5 6 6 5 3 5 3 6 46.0 -4.0 0
Bill John 5 5 4 7 5 6 4 6 3 5 45.0 -3.0 2
TJ Donegan 5 5 5 5 7 3 4 4 3 6 42.0 2.0 2
Devin Carrigan 0 6 4 5 5 4 2 4 4 6 40.0 -2.0 0
Curt Smith 7 6 6 7 5 5 4 6 4 6 49.0 -5.0 0
Dale Russell 7 6 5 5 6 5 4 5 4 6 46.0 -2.0 2
Joe Donegan 9 7 6 9 4 6 3 6 4 5 50.0 -2.0 2
Art Brillanti 11 10 5 9 6 5 5 6 5 5 56.0 -4.0 0
Connor Brown 0 5 4 5 6 5 3 5 4 6 43.0 -6.0 0
Jon Carroll 4 6 6 6 5 4 4 4 3 5 43.0 -2.0 2
Marty Donegan 7 6 4 7 7 5 6 3 4 5 47.0 -1.0 2
Mike Burns 9 5 5 7 6 6 6 6 3 6 50.0 -4.0 0
Denny Welch 10 9 5 7 6 5 5 6 5 5 53.0 -4.0 2
Jason Driscoll 8 8 5 8 6 5 5 5 4 9 55.0 -6.0 0
Craig Hawkinson 4 7 4 6 4 4 3 4 3 5 40.0 1.0 2
Pat Donahue 3 5 4 5 6 5 3 5 4 5 42.0 -2.0 0
Team Player Quota Perf Pts Total
1 Brian Thompson 3 2 7
Rick Fanto -3 2
Bob Zaleski 2 2
2 Dick Donegan 2 2 7
Dan Mahar 0 2
Tom Donegan 3 2
3 Steve Donegan -2 0 0
John Mooney -8 0
Tony Massa -2 0
4 Craig Hawkinson 1 2 7
Marty Donegan -1 2
Joe Donegan -2 2
5 Pat Donahue -2 0 0
Mike Burns -4 0
Art Brillanti -4 0
6 Devin Carrigan -2 0 2
Bill John -3 2
Jason Driscoll -6 0
7 TJ Donegan 2 2 5
Tom Phillips -4 0
Denny Welch -4 2
8 Jon Carroll -2 2 7
Dale Russell -2 2
Gary Thompson 4 2
9 Connor Brown -6 0 0
Curt Smith -5 0
Bill Kirkby -1 0
10 Vinny Procopio -3 0 2
Chris Donegan -1 2
Gary Antos -1 0
11 Mike Carroll 1 2 5
DJ Mahar -3 0
Jim Morgan 0 2
12 Nick Wight -6 0 0
Matt Lochner -5 0
Pat Cregg 1 0


Quick Stats for those drafting…

Put together some stats for those of us looking to make the smartest pick on draft day. Here’s how to read the chart

I looked at each player available in the draft. I broke EVERY season they’ve played into a First Third (Weeks 1-6), Middle Third (7-12), and Final Third (13-18). I’ve also split it to show you how they do on the Front vs. the Back in the various phases of the year.

So reading across is how someone does on that particular side. Reading down is how well they perform in the various phases. Shows Wins, Losses, Ties, DNP’s (Did Not Play – Times they didn’t show up or the week was cancelled), Skin money won, Average round score, Win Percentage.

Click on the photo to make it bigger

draft stats


IT NERD

IMG_4625

TBO Golf, Round 9: The Draft… Jesus, you people again?

It’s that time of year again, you god damn degenerates….Time for Drew Prucha to pull his clubs out of the attic and dust them off 5 minutes prior to Week 1. Time for the Snow Pigs Dorks to put the snowmobiles and “sleddy talk” away for next year. Time for Jack to make his pilgrimage back to the great white north.

Before continuing, the IT Nerd has a few announcements:

  • As El Commish has informed the IT Nerd, we have one casualty over the winter: Sean Mott. I for one would like to wish him the best and look forward to hopefully seeing on the course as a sub this year.
  • Congrats to Dan Mahar and Marty Donegan for climbing out of the sewers of Flight 3 and claiming a spot in Flight 2. Yes Flight 3 guys,I called your flight the sewer…fucking deal with it, pansies.
  • Last but not least, congrats to Jon Carroll on climbing out from his troll dwelling under the bridge on #18 to claim a spot in Flight 1. Seems like yesterday Jon claimed two of the three worst performances in TBO history (62 and 61 back to back). All $5,925,682.74 you spent on lessons has paid off!

Enough with all the nice crap, lets get down to the matter at hand: The fucking TBO Draft. While the IT Nerd will not be putting out his Big Board like Mr. Kiper, I will be providing you with 40 yd dash times, Vertical jumps and golf statistics. In no particular order, here’s who available in the 2016 TBO Draft


Tom “T-Bird” Phillips

291083_2251409358966_1414152374_o

Vitals – 40 Yd Dash: 7.93s, Vertical Jump: 18″

Highest and Lowest Finish – 2nd  (2008), 14th (2010)

Pros – Dependable to play his matches, die hard Syracuse fan

Cons – Fingers go in 8 different directions, loves the KC Royals, member of Snow Pigs Dorks

IT Nerd Analysis – If T-Bird can get through his early season struggles, particularly on the front (33% win percentage), he typically finishes the year very strong (57% win percentage). Projected Pick: #2


DJ Mahar

1934660_1041863771627_1202227_n

Vitals – 40 Yd Dash: 6.98s, Vertical Jump: 21″

Highest and Lowest Finish – Champion (2014, 2012), 13th (2011)

Pros – Potential to shoot 36 on any given day, mental edge to seal championships

Cons – Potential to shoot 50 on any given day, Buffalo Bills fan, member of Snow Pigs Dorks

IT Nerd Analysis – Championship material, folks. In 3 of the past 4 years, DJ has won or finished second. DJ gets out of the gates very strong. While his win % tapers off as the year goes on, if a team can absorb the lackluster performance down the stretch, its a great pick. Rings matter more than win %’s, anyway. Projected Pick: #1


Drew Prucha

prucha

Vitals – 40 Yd Dash: 17.22s, Vertical Jump: -4″

Highest and Lowest Finish – Champion (2013), 16th (2011)

Pros – Can select an excellent Ragu sauce, “nothing to lose” mentality

Cons – His minivan can sometimes be confused for a child molester van

IT Nerd Analysis – Drew is a slow starter, picks up steam in the middle sessions, then fades away. Maybe if he swing a club for the first time prior to Week 1, he might shake some of that early season rust. Projected Pick: #5


Bill John

22628653-Two-boys-playing-with-a-paper-cup-phone-Stock-Photo

Vitals – 40 Yd Dash: 7.88s, Vertical Jump: 18″

Highest and Lowest Finish – Champion? (2015), 2nd (2014)

Pros – Plays well without the use of modern clubs, shows promise of consistently high finishes

Cons – uses subs frequently

IT Nerd Analysis – While Bill John’s displays on the course leave little doubt as to his talent, the questions surrounding his ability to actually get to the golf course. GM’s tell me this will likely have an impact on his draft stock. Projected Pick: #12


Jack Donegan

101084216-jack-nicklaus.1910x1000

Vitals – 40 Yd Dash: 13.12s, Vertical Jump: 10″

Highest and Lowest Finish – 9th (2011), 15th (2013)

Pros – Has seen it all and done it all on a golf course, will be coming from spring training in Florida

Cons – Used to manicured Florida greens, not the Tanner Valley crab grass.

IT Nerd Analysis – Jack is a crafty veteran who will have more holes of golf in by March than some of us get in all year. Jack earns the bulk of his points in the middle of the year on his preferred side (front) when Syracuse warms up to Florida temps. If a team can live with a sub for the first few weeks while Jack settles back to the frozen tundra, this would be a value pick. Projected Pick: #9


Dale Russell

golf-push-cart-seat-seat-cart

Vitals – 40 Yd Dash: 7.08s, Vertical Jump: 15″

Highest and Lowest Finish – 2nd (20090), Last (2014)

Pros – In better shape than 90% of the league, knows every course nuance by walking his rounds

Cons – Hates projects managers (we hate you too Dale),

IT Nerd Analysis – Dale’s Win %’s decline as the year progresses, but he’s dangerous on the front early to mid year. If Dale’s partners are slow starters, he may be a good pick to support the team early on.  Projected Pick: #6


Chris “El Commish” Donegan

599934_655684536401_213044151_n


Vitals – 40 Yd Dash: 8.43s, Vertical Jump: 10″

Highest and Lowest Finish – Champion (2015), Last (2014)

Pros – only man with Perfect Attendance in the entire TBO History, coming off hot streak in 2015,

Cons – loves to snap hook drives, drinks Coors Light, lays up twice before the creek on #3

IT Nerd Analysis – El Commish is coming off an unprecedented “last-to-first” finish in 2015. Chris performs better in the first third of the year, so a team may be willing to take those early points if they can provide support on the backend. Projected Pick: #4


Matt Lochner

403305_585287911387_534407836_n

Vitals – 40 Yd Dash: 6.79s, Vertical Jump: 8″

Highest and Lowest Finish – 2nd (2013), 16th (2011)

Pros – Can still down that Coqui 900 that costs $1.25 at Bob’s Beverage Baron, knowledge of SU recruiting is astonishing

Cons – Does not perform well on the back 9, can’t beat Jon Carroll

IT Nerd Analysis – Matt’s finishing positions have been increasing the last few years, so he might be due for a breakthrough. Scouts point to his weakness on the back 9 as a serious drawback. Teams will have to carry Matt during the middle portions of the year, while he provides supports on the start and finish.  Projected Pick: #3


Mike Burns

Mr._Burns

Vitals – 40 Yd Dash: 8.79s, Vertical Jump: 13″

Highest and Lowest Finish – N/A

Pros – Helped Jon Carroll/DJ Mahar into a position where they contended for the title in 2015

Cons – An unknown commodity

IT Nerd Analysis – Little is known of this golfer other than his performance as a super-sub for the Carroll/Mahar team.  He’s earned a 6-4-3 record over the years and will be slotted in Sean Mott’s old spot. His wildcard status drops him in the draft. Projected Pick: #11


Rick “Fabulous” Fanto

231118_1768689934853_4311568_n

Vitals – 40 Yd Dash: 8.33s, Vertical Jump: 7″

Highest and Lowest Finish – 5th (2013), Last (2015)

Pros – Expert knowledge on car washing/waxing, rolls a mean frame

Cons – never finished higher than 5th place,

IT Nerd Analysis – Rick is a TBO veteran having played in every season since 2008. Rick is a classic TBO slow starter. Teams who have hot starters should consider him to carry the load at the end of the year as the more glamorous picks go by.  Projected Pick: #7


Daniel Mahar

10403021_10155641073140063_8673357848693647900_n

Vitals – 40 Yd Dash: 8.34s, Vertical Jump: 13″

Highest and Lowest Finish – 5th (2014), 15th (2012)

Pros – Will close down the bar with you, may fight Kevin K., Yankee fan

Cons – not know for high team finishes, potential rookie learning curve in Flight 2

IT Nerd Analysis – Dan’s scores have indicated a higher individual performance, but his team positions don’t suggest improvement. Performs better on the front than the back, teams should be mindful if Dan gets into a mid-season slump that could derail the entire season. Large unknown if Dan can produce the same results in Flight 2. Projected Pick: #10


Martin P. Donegan

2086_1079401713706_45_n

Vitals – 40 Yd Dash: 27.65s, Vertical Jump: None registered. Machine broke from seismic activity when Marty landed. Estimated at .53″

Highest and Lowest Finish – Champion (2010), Last (2014)

Pros – Can eat a chicken wing faster than the time it took you to read “Can eat a chicken wing…”, owns the Florida Ruby Tuesday record for most wings eaten in one sitting (74 – I was a witness), clutch play displayed on final hole of 2010 Championship Round

Cons – If Marty gets into “dippin’ my shoulder” mode, scores skyrocket, can be heard anywhere on the course after a shank with the familiar “OH NOOOOO!!”

IT Nerd Analysis – While Marty struggled in 2011 and 2012 after his 2010 crown, 2014 saw him bounce back and move up to Flight 2. Marty racks up higher Win %’s as the year goes on, so a team of slow starters should look elsewhere. GM’s tell me they expect the Flight 2 pack to chew Marty up and toss him out the car window like Marty’s to-go order of wings. Projected Pick: #8


SEE YOU HOMOS SATURDAY


IT NERD

IMG_4625

TBO 2015 Year in Review: Final Review

Well folks, its time to close out another successful TheBarisOpen golf season. Big congrats to long time TBO members El Commish and Tom Donegan on their first championship win.

To wrap up after such a great season, I’ll again need the assistance of a certain big time TBO golf fan…

908d7442fd6e459bee0d5064b4da3785272ec26b8a3907c37d6257c6e6cb8bfd

Hey Jim, glad you could join us for the final wrap up after helping with the preseason projections. Just to quickly recap, what did you think of my pre-season pick of Joey, Jack and Sean Mott?

nantz chances


That’s what I thought you said. Turns out Jim, you were actually quite accurate in your assessment! What is your take on the team that ended up taking down the title?

coorslight

How kind of you Jim to offer a toast to the winners. But Coors Light, Jim? Who drinks that?

clightdrinker

Quite a humorous observation, Jim. Coors Light is the official beer of Nancy Boys. Moving off the teams, let’s take a look at the Individual Standings….

Player Quota Pts Pts. % Wins Loses Ties Win % Skins Winnings
Devin Carrigan 17 24 66.7% 12 6 0 66.7% 6 70
Brian Thompson 14 21 65.6% 9 4 3 56.3% 11 130
Tom Donegan 6 23 63.9% 10 5 3 55.6% 3 21
Pat Donahue 14 21 61.8% 9 5 3 52.9% 8 78
Sean Mott 9 22 61.1% 10 6 2 55.6% 2 27
Chris Donegan 11 22 61.1% 10 6 2 55.6% 2 21
Nick Wight 13 21 58.3% 9 6 3 50.0% 8 82
Dan Mahar 8 21 58.3% 10 7 1 55.6% 16 151
Jon Carroll 13 21 58.3% 9 6 3 50.0% 5 89
Steve Donegan 12 18 56.3% 7 5 4 43.8% 4 68
Drew Prucha 11 18 56.3% 8 6 2 50.0% 5 55
Connor Brown 17 19 55.9% 9 7 1 52.9% 12 149
Pat Cregg 7 19 55.9% 9 7 1 52.9% 6 53
TJ Donegan 12 20 55.6% 8 6 4 44.4% 4 44
Bob Zaleski 6 20 55.6% 9 7 2 50.0% 3 54
Gary Antos 8 15 53.6% 7 6 1 50.0% 6 42
Tom Phillips 12 17 53.1% 8 7 1 50.0% 6 65
Jim Morgan 8 18 52.9% 8 7 2 47.1% 7 60
Matt Lochner 10 19 52.8% 9 8 1 50.0% 5 60
Dick Donegan 13 18 50.0% 6 6 6 33.3% 5 50
Marty Donegan 10 18 50.0% 9 9 0 50.0% 2 26
DJ Mahar 13 18 50.0% 8 8 2 44.4% 0 0
Bill John 12 13 50.0% 6 6 1 46.2% 1 18
Bob Moran 6 17 47.2% 8 9 1 44.4% 1 12
Gary Thompson 6 16 47.1% 7 8 2 41.2% 2 19
Dale Russell 10 14 43.8% 7 9 0 43.8% 4 45
Mike Carroll 12 14 41.2% 6 9 2 35.3% 8 109
Denny Welch 7 11 39.3% 4 7 3 28.6% 8 58
Vinny Procopio 13 12 37.5% 6 10 0 37.5% 2 21
Art Brillanti 6 12 37.5% 5 9 2 31.3% 6 67
Tony Massa 9 13 36.1% 6 11 1 33.3% 0 0
Bill Kirkby 5 12 35.3% 5 10 2 29.4% 3 36
Joe Donegan 8 11 32.4% 5 11 1 29.4% 7 67
Jack Donegan 11 9 30.0% 4 10 1 26.7% 1 12
Craig Hawkinson 13 9 26.5% 4 12 1 23.5% 5 53
Rick Fanto 10 6 18.8% 2 12 2 12.5% 1 18

Devin Carrigan leading the charge after a horrendous start by his standards. Jim, your thoughts on Devin?

nantz-devin


Interesting outfit on the squirrel, Jim….interesting.

Anything else stick out to you from the Individual Standings?

prucha


Now that you mention it, Jim, it did seem like it was the same outfit! Wonder what his one outfit will be next year…Back to the recap, Jim. Is there something you’d like to say to anyone in the league?

jonloser

Strong words to take us out, Jim! As such an ardent TBO fan, aren’t you concerned about how these harsh words can be taken by the league?


nantzhate

There you have it! No holds barred from the biggest TBO fan on the Planet. Jim Nantz, Ladies and gentlemen!

TBO 2015 Year in Review: Rule Changes

Heading into 2015, the off-season meeting led to the implementation of 3 changes:

  1. Reduction in value of an Eagle from 8 points to 6 points
  2. Incurring of -1 point for scoring of Double Par
  3. Changing Quota formula to be based on the last four weeks of play and allow for Quotas to move more than 1 pt per week

Reduction in value of Eagle from 8 to 6 points:

The was no real statistics behind this. The logic was that achieving an eagle for 8 points made the match insurmountable for the opponent, thus reducing the match down to the one lucky/skillful hole.

This rule change had minimal impact in 2015. There were only two eagles for the entire year (TJ Donegan on #13, Brian Thompson on #18).

IT NERD OPINION:

This rule change had minimal impact. If anything, it helps the league overcome a “lucky/skillful” hole.


Incurring -1 point for scoring of Double Par:

Here’s how the league did in terms of registering Double Pars for 2015 (middle column) and 2014 (right column). As you can see, there were more Double Pars in 2015 than 2014.

DPcount


When looking at how players scored relative to their Quota in 2014, it was seen that the various flights performed differently. The black line is what is considered a “normal” distribution…or how we want the scoring to look.

2014 Graphs

In looking at 2014, it seemed that Flight 3 was able to score well versus their quotas. Two players scoring 115%-125% and one player scoring over 135% of their quota

2014f3

Flight 2 was more centrally distributed.

2014f2

Flight 1 was centered as well with a slight skew to higher performance.

2014f1


Heading into 2015, we wanted to get the Flight 3 graph to look more like Flight 1 or 2. Hence, the introduction of the -1 point for Double Par. Here’s how the graphs look for 2015

2015 Graphs

For 2015, Flight 3 shifted from over-performance against the quota to under-performance. When you look at the graph, it would appear that the Flight 3’s were hit hard by the -1 point rule. However, when you look deeper at the numbers, it wasn’t due to this rule.

2015f3

Like last year, Flight 2 was also pretty centrally distributed.

2015f2

Flight 1 is almost a mirror image of Flight 2, very centrally distributed.

2015f1


IT NERD OPINION:

The intent of the rule was to bring Flight 3 back into a more normal distribution. Flight 1 and 2 are coming in right where we want them. So what happened to Flight 3 this year? 

When you dive deeper into the numbers for Flight 3, it wasn’t the occurrence of Double Par the drove the lower performance. Of the golfers below the 95%-105% line, only one of those golfers had more than 5 Double Pars for the entire year. For those keeping track at home, 5 Double Pars represent only about 3% of the total scores. 

The reality is that it was more of rise averages. Those golfers at the lower ends of the graph of Flight 3 saw a rise in their averages. That means there were more double bogeys, triple bogeys for those golfers, not so much a large rise in Double Pars.

Overall, I’d say the the rule was a success and should be a continued part of the league


Changing Quota formula to be based on the last four weeks of play:

The 2014 Quota formula was based upon the player’s performance over the entire year up to that point. While it was relatively easy to fluctuate Quotas in the early parts of the year, it became nearly impossible to move a Quota in the last few weeks of the year. This went counter to how players were actually performing. Players were getting better as the year went on, especially towards the end. However, due to the formula, their Quotas were not decreasing at the same rate in which the player’s scores were decreasing. We needed to have the formula be more responsive to how the player was actually performing over the past month, rather then how they did 3 months ago. Thus, the Quota formula was modified to only take into account the last four weeks of play.

The second piece to this change was about allowing Quotas to move more than 1 point per week. If someone is really struggling or catching fire, their Quota should be allowed to move to properly reflect the players current situation.

To provide a perfect example of how this works, look no further than Connor Brown and his 2015 year. The blue line on the below graph shows what Connor’s Quota would have been for 2015 using the old Quota formula (entire year). The red line shows what his Quota was using the new formula (last 4 weeks).

Connor


What this shows you is that Connor’s Quota stays stagnant in Week 15-18…just when he started to heat up! In the old format, Connor would have been under quoted by nearly 3 points!

IT NERD OPINION:

This change was probably the one that had the most impact. I got FAR LESS questions this year of “I just shot X, how am I still a Y?”. Player’s Quotas were also allowed to move more than one point per week as a part of this change. I think the entire league can agree: the Quota should be reflecting how a player is performing lately as opposed to over the entire year, which could be more than a few months ago!


TBO 2015 Year in Review: Statistics

Top 5 Luckiest Golfers:

  1. Gary Thompson – His opponents were -29 vs tMheir Quotas for the year
  2. Tom Donegan – Opponents were -28 vs their Quota
  3. Chris Donegan – Opponents were -21
  4. TJ Donegan – Opponents were -21
  5. Sean Mott – Opponents were -19

Top 5 Unluckiest Golfers:

  1. Marty Donegan – Opponents were +25 vs. their Quotas for the year against Marty
  2. Rick Fanto – Opponents were +22 vs. their Quota
  3. Art Brillanti – Opponents were +18
  4. Bill Kirkby – Opponents were +16
  5. Tie for 5th – Joe Donegan and Craig Hawkinson opponents were +15

Top 5 Over-performing Golfers:

  1. Connor Brown – Connor was +26 vs his Quota for the year
  2. Brian Thompson – +17 vs his Quota
  3. Devin Carrigan – +15 vs his Quota
  4. Pat Donahue – +15
  5. Mike Carroll – +11

Top 5 Underachieving Golfers:

  1. Tom Donegan – Tom was -26 vs. his Quota for the year
  2. Jack Donegan – Jack was -19 vs. his Quota for the year
  3. Dale Russell – -16 vs his Quota
  4. Gary Thompson – -16 vs. his Quota
  5. Bob Moran – -14 vs. his Quota


2015 Records:

  • Most Blow-out Losses (loss by 3 points or more) – Marty Donegan with 8
  • Most Blow-out Wins (wins by 3 points or more) – Bob Zaleski and Pat Cregg tied with 8
  • Biggest Margin of Victory – Devin Carrigan (+10) over Marty Donegan (-3)
  • Most Close Wins – Tom Donegan and Devin Carrigan tied with 4
  • Most Close Losses – Craig Hawkinson with 5
  • Most Wins – Devin Carrigan with 12
  • Most Losses – Rick Fanto and Craig Hawkinson tied with 12
  • Most Ties – Dickie Donegan with 6
  • Most Skins – Dan Mahar with 16
  • Most Skin Winnings – Dan Mahar with $151
  • Least Skins – DJ Mahar and Tony Massa with 0 skins
  • Perfect Attendance: Devin Carrigan, Nick Wight, Dickie Donegan, TJ Donegan, Craig Hawkinson, DJ Mahar, Matt Lochner, Marty, Donegan, Sean Mott, Tony Massa, Chris Donegan, Jon Carroll, Bob Zaleski, Bob Moran, Dan Mahar, Tom Donegan

2015avgs