Stat Boy’s 2015 Projections…and yes, its insane

With the new rule changes coming into place (Double Par is -1 pt, Quota only considering your last 4 rounds, Eagles dropping to 6 pts), the IT Nerd wanted to see how this would play out for the 2015 season. Think of it as the Pre-Season polls. I took a players last two seasons for a particular week and averaged them together. So if in Week 1, a player shot a 5 in 2014 and a 7 in 2013 on Hole #1, I would consider them getting a 6 on that hole for 2015.

To help me unveil these scores, I need a little assistance from a big fan of TBO Golf.

908d7442fd6e459bee0d5064b4da3785272ec26b8a3907c37d6257c6e6cb8bfd


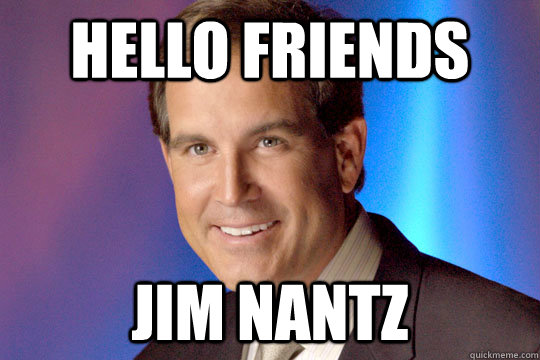
Jim, thanks for taking the time to stop by and chat. Let’s start by looking at the individual players and how they are projected to perform:

Player Quota Pts Pts. % Wins Loses Ties Win % Skins Winnings
Jim Morgan 10 25 69.4% 11 4 3 61.1% 7 84
Joe Donegan 10 25 69.4% 12 5 1 66.7% 10 92
Pat Cregg 8 25 69.4% 11 4 3 61.1% 6 70
Pat Donahue 15 24 66.7% 12 6 0 66.7% 5 66
Bob Zaleski 5 24 66.7% 10 4 4 55.6% 1 18
Brian Thompson 13 24 66.7% 12 6 0 66.7% 6 73
Jack Donegan 13 24 66.7% 11 5 2 61.1% 1 36
Mike Carroll 14 22 61.1% 9 5 4 50.0% 10 95
Devin Carrigan 16 21 58.3% 9 6 3 50.0% 9 137
Matt Lochner 11 21 58.3% 8 5 5 44.4% 1 12
Connor Brown 15 21 58.3% 10 7 1 55.6% 5 57
Bill John 13 20 55.6% 9 7 2 50.0% 6 66
Art Brillanti 5 20 55.6% 9 7 2 50.0% 3 33
Denny Welch 10 19 52.8% 7 6 5 38.9% 9 99
Nick Wight 16 18 50.0% 7 7 4 38.9% 6 73
Dan Mahar 9 18 50.0% 8 8 2 44.4% 1 18
Sean Mott 11 18 50.0% 7 7 4 38.9% 5 96
Marty Donegan 8 18 50.0% 6 6 6 33.3% 1 12
Dale Russell 13 18 50.0% 7 7 4 38.9% 6 103
Vinny Procopio 12 17 47.2% 5 6 7 27.8% 2 25
Gary Thompson 9 17 47.2% 8 9 1 44.4% 7 80
Jon Carroll 13 17 47.2% 7 8 3 38.9% 7 108
Rick Fanto 11 17 47.2% 7 8 3 38.9% 2 21
Tom Phillips 12 16 44.4% 7 9 2 38.9% 6 61
Bob Moran 6 16 44.4% 5 7 6 27.8% 0 0
Dick Donegan 13 15 41.7% 7 10 1 38.9% 2 24
Tom Donegan 7 15 41.7% 6 9 3 33.3% 3 66
Bill Kirkby 4 15 41.7% 6 9 3 33.3% 2 27
Craig Hawkinson 13 15 41.7% 7 10 1 38.9% 4 45
Drew Prucha 10 14 38.9% 5 9 4 27.8% 1 12
TJ Donegan 13 13 36.1% 5 10 3 27.8% 4 48
Chris Donegan 11 13 36.1% 5 10 3 27.8% 3 42
Steve Donegan 13 13 36.1% 5 10 3 27.8% 2 15
Tony Massa 9 11 30.6% 4 11 3 22.2% 1 12
Gary Antos 9 11 30.6% 4 11 3 22.2% 4 60
DJ Mahar 12 8 22.2% 4 14 0 22.2% 2 19

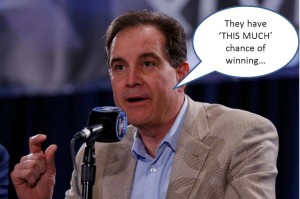
Wow Jim, looks like Jim Morgan had a fantastic year. What are your thoughts on that?

NAntz sandbag

Spot on, Jim. No wonder CBS pays you so well. Now how about the person in second? I believe he’s known as Joey “Jaguar Steelz” Donegan?

Nantz silent

I don’t know what a “Jaguar Steelz” is either Jim, but judging by that look of disbelief I’m guessing that you don’t believe he’ll do as well as projected. History is on your side, Mr. Nantz. Joey has only finished in the Top 10 once, finishing 8th in 2011. But what about those at the bottom? DJ Mahar to finish last? Your immediate reaction, Jim?

nantz stunned

I see you are just as shocked as I am. I find it hard to believe that a past champion who is the caliber player DJ is to struggle that much. Also, Gary Antos at the bottom as well? What comes to mind when you think of a player like Gary?

nantzcalves

That’s quite a smile for you there, Jim. Those thunder-calf muscles really get you going? Before you get too much of a hard-on, let’s take a look at the team projections. Which team is projected to take down the coveted prize?

Team Standings Pts Pts Back Team
Jack Donegan Sean Mott Joe Donegan 80                – 7
Connor Brown Brian Thompson Art Brillanti 78            (2.0) 4
Nick Wight Matt Lochner Bob Zaleski 74            (6.0) 2
Pat Donahue Mike Carroll Bob Moran 70.5            (9.5) 3
Dick Donegan Dale Russell Jim Morgan 67.5          (12.5) 5
TJ Donegan Marty Donegan Pat Cregg 63.5          (16.5) 6
Devin Carrigan Drew Prucha Bill Kirkby 62.5          (17.5) 1
Vinny Procopio Tom Phillips Gary Thompson 60          (20.0) 12
Steve Donegan Rick Fanto Denny Welch 57          (23.0) 9
Bill John Chris Donegan Tom Donegan 55          (25.0) 10
Craig Hawkinson Tony Massa Dan Mahar 49          (31.0) 8
DJ Mahar Jon Carroll Gary Antos 39          (41.0) 11

Just shocking, Jim. The team of Joey, Jack and Dean Mott are projected to take down the prize. What a bold prediction by the Stat Boy. How would you assess their chances of executing on the prediction?

nantz chances

They certainly have a lot of work to do if they want to walk away with the title. Who do you think is actually going to walk away with the title then?

JimNantz-scenes1

Jesus Jim…what a douchebag. We’re talking golf here, not baseball. This isn’t a joke, Jim. If Jon Carroll finishes last, he may drown himself in the creek on #18.

jim_nantz reading

That’s more like it….serious studying of the in-and-outs of Tanner. Nice sweater vest, asshole. All kidding aside Jim, I’d like to thank you for stopping by to help me preview the 2015 TBO Golf season. First beer is on me!

chirkinian


Here’s the full 2015 file for those interested:
2015 Projections text

Gearing up for 2015

139465dd784ab62091bf11f0038d07585ea5399a86b7fab17ee335da2b53ca15

With the long brutal winter now starting to pass us (knock on wood) and a date set for our preseason meeting, the IT Nerd wanted to drop some knowledge on you. Things to rattle around in your head during those dull times at work. Given by Joey Donegan’s email frequency, he has plenty of spare time…

As part of this preseason meeting, we’d talk tweaks to the current system to improve it. I highlighted a few ideas at the end of last year. After a winter off from staring at statistics, its time to put the nerd glasses back on, stare at the screen for hours and evaluate the ideas.

  1. A Quota “Floor” or minimum: The thought behind this is so that those with low quotas don’t meet or exceed their quota with one hole or one lucky shot.
    • Minimum of 5 – Only five guys had a quota at 5 or lower, accounting for roughly 6% of all rounds. Bill Kirkby had a quota below 5 the entire year. Ironically, all five guys who had a quota below 5 ALL AVERAGED at least 5 pts. Bobby Z averaged 5.1 pts, Bill Kirkby averaged 5.7 pts, Bobby Mo averaged 5.8 pts, Artie averaged 6.1 pts and Jim Morgan Averaged 7.1 pts. Therefore, a quota floor of 5 wouldn’t really challenge anyone.
    • Minimum of 6 – The goal should be to stike a balance between hitting a Quota and not hitting a Quota. With the Quota of 6, you would at least challenge the bottom few golfers. Take Bill Kirkby for example. If he had a Quota floor of 6, he would have hit or surpassed it ~43% of the time. With no Quota floor, he hit or surpassed his Quota 93% of the time. Compare that with the top Golfer (Devin Carrigan) who hit or surpassed his Quota 72% of the time. Needless to say, Quota Floor of 6 is one change the IT Nerds recommends.
  2. Minus 1 point for triple bogey or worse: Similar to the previous, this would discourage “sandbagging” by offering an incentive for not blowing up on a hole. It would also pull some of the lower quota players scores down. 
    • Minus 1 for Triple Bogey – This would have too much impact across the league. Would bring scores for a large majority of the league by at least half-a-point, with half the league being impacted severly.
    • Minus 1 for Double Par –  Has moderate impacts through Flight 2’s and upper Flight 3’s and a pretty sizeable impact on lower Flight 3’s. However, even with a -1 pt for double par, only four players would average BELOW 6 pts per week (Bobby Z 4.2, Bill Kirkby 4.4, Bobby Mo 5.2, Artie 5.7). Minus 1 for Double Par is a change the IT Nerd recommends.
  3. Modification of Quota Scoring Formula Starting Point This would just raise Quotas across the entire league and wouldn’t really solve the inequities between high and low Quotas. IT Nerd does not recommend this change.
  4. Modification of Quota Scoring Formula to look at last 4, 5 or six rounds, not entire season – Long story short, Quota’s get locked in too early in the season and it becomes extremely difficult to change them over the last half of the season. Read below if you want more details. This is a remedy to the CONSTANT questioning I get: “How I am still an ‘X’ Quota when I just shot ‘Y’?”
    • Obviously, Quotas can’t move until after 2 rounds have been played. Under the old Scoring Formula, what you find is that Quotas fluctuate freely the first 4-5 weeks because scores fluctuate. The next 4-5 weeks sees Quota movement drop off sharply (almost 50% drop in Quota movement). The final 6-8 weeks, forget about having your Quota to move, its damn near impossible. Only about 3-4 guys per week in the final 4 weeks have a Quota move. The problem with this system? Scores across all Flights trend downward throughout the year, thus not allowing Quota adjustments for mid or late year improvements. Therefore, what you see is that scores keep decreasing, but Quotas are too slow to react and never able to catch back up to actual play
    • I looked at what using the last 4 rounds played would look like. Over the first 4 weeks, it exactly mirrors what the current system is. The key benefit to this change? The pace and direction of the Quota change is roughly equal to that of the actual scores…which is the goal isn’t it? Using the last four rounds played as the Quota Scoring Formula base is a change the IT Nerd recommends.
  5. Removal of the “Max +/- 1 Quota movement per week – Concept is to allow Quota to move with the Player’s actual scores. The Max Movement is instituted to prevent wild fluctuations.
    • If you removed it completely, there are times when Quotas can move 3 or 4 pts in one week. This is mostly in the Week 2 and 3 as there is a lack of Player Scores. That’s too much fluctuation for one week
    • If this rule was to be modified, it should be moved to a Max +/- 2 Quota movement per week. The IT Nerd is neither for or against this change.  


See you bitches at Swallows…

IT Nerd


2014 Wrap-up

With the year end tournament coming up on Saturday, it’s time for the IT Nerd to retire from spending WAY too much time on this site and golf stats…

2014 was a year of change for TBO. We ditched the old Match play scoring in favor of the Modified Stableford Quota Scoring system. This radically changed the way in which you approach your matches. We also moved to three man teams from two man. We went from four 8-man flights to three 12-man flights and had a random draw to determine the third man. Cross-flight play was introduced to mix up the competition. Lots of changes were made and the use of past year’s stats were applied in an attempt to make the best decisions.

That being said, I wanted to plant in all your minds some thoughts to think about over the winter. Given that this was our first year in the new system, I think that we need to review what worked/what didn’t work and think about how to improve for next year.

Below are lists of ideas to improve for next year. I’d still need to review the impact of each proposed idea and run it by the Commish to get his thoughts. Also, we’d probably need to get the entire league to weigh in at the preseason meeting before making any changes.

  1. A Quota “floor” or minimum – Given that some guys have Quota’s that are super low, it just takes one or two good shots to meet these quotas. This idea would make it so that a Quota could not dip below a certain number, say 5 or 6.
  2. Minus 1 point for scoring triple bogey or worse – The thought is that once folks reach double bogey, they have no points anyway and its in their best interests to just get a double par. This would provide incentive for getting in with a double bogey. Would need to see how big of an impact this would be.
  3. Modification of Quota Scoring Formula Starting Point – Without getting into too much detail, the idea here would be to make Quota’s go up across the entire league, thus making it harder to hit your quota.
  4. Modification of Quota Scoring Formula to look at last 4, 5, or 6 rounds, not entire season – Currently, Quota’s are relatively easy to move in the early parts of the year and it gets harder to move it towards the end of the year, regardless of how you are actually playing. The idea here is that the Quota system would be reflecting how you are playing over the last 4, 5 or 6 rounds, not over the entire season.
  5. Removal of the “Max +/- 1 Quota Movement” per week – Somewhat closely related to the previous bullet, the idea is that the Quota would be reflecting how you are actually playing. The thought is that if you really are playing well or bad, the Quota would follow you there ASAP as opposed to needing 2-3 weeks to adjust.

All thoughts that will be reviewed, debated, discussed, mulled over in the off season!

See you all on Saturday.

IT Nerd

Nerd

Random 2014 Stats

Who’s got the most rings in the league???

Two-Time winners: Nick Wight (2011, 2014), DJ Mahar (2012, 2014) and Jon Carroll (2011, 2012)

One-Time Winners: Bob Moran (2014), Hawkinson and Prucha (2013), TJ and Marty (2010), Mott and Antos (2009), Steve and Scott Gasiorowski (2008)


Earlier in the year, I looked at the luckiest/unluckiest golfers and over/under performers against Quota. Time to revist the Top 5 for each category.

Top 5 Luckiest Golfers:

  1. Nick Wight: Nick’s Opponents were -19 against him
  2. Drew Prucha: -16
  3. Connor Brown: -12
  4. Matt Lochner: -11
  5. Brian Thompson: -5

Top 5 Unluckiest Golfers:

  1. TJ Donegan: Opponents were +29 against their Quota vs. TJ
  2. Art Brillanti: +26
  3. Pat Cregg: +23
  4. Steve Donegan: +23
  5. Denny Welch: +19

Top 5 Overperformers against Quota:

  1. Bill Kirkby: Bill was +39 vs his Quota over the season
  2. Devin Carrigan: +30
  3. Dickie Donegan: +27
  4. Connor Brown: +26
  5. Bobby Moran: +24

Top 5 Underperformers against Quota:

  1. Matt Lochner: -25 against his Quota
  2. Chris Donegan: -13
  3. Gary Thompson: -10
  4. Gary Antos: -9
  5. Tom Phillips: -8

The below table shows reflects where everyone is projected to be flighted next year. It asks the question: If the player listed stepped up to the tee, what’s the chance they score an Eagle, Birdie, Par, Bogey or gets no points at all?

    Eagle % Birdie % Par % Bogey % No Pts % Avg Round Points Avg Quota Avg Perf
Flight 1 Devin Carrigan 0.7% 10.4% 50.7% 28.5% 9.7% 15.9 13.9 2.0
  Nick Wight 0.0% 9.8% 49.0% 31.4% 9.8% 15.2 13.9 1.3
  Pat Donahue 0.0% 9.2% 49.7% 31.4% 9.8% 15.1 13.5 1.6
  Connor Brown 0.0% 4.3% 51.9% 36.4% 7.4% 14.2 12.4 1.8
  Dick Donegan 0.0% 6.8% 45.1% 30.9% 17.3% 13.3 12.4 0.9
  TJ Donegan 0.0% 4.9% 43.8% 36.4% 14.8% 12.9 12.2 0.7
  Jack Donegan 0.0% 0.8% 42.9% 43.7% 12.7% 11.9 11.9 0.0
  Craig Hawkinson 0.0% 3.9% 41.2% 35.9% 19.0% 12.1 11.1 1.0
  Steve Donegan 0.0% 3.3% 40.5% 42.5% 13.7% 12.3 11.6 0.7
  Bill John 0.0% 5.2% 39.9% 32.7% 22.2% 12.0 11.8 0.2
  DJ Mahar 0.0% 5.6% 35.4% 38.9% 20.1% 11.9 11.8 0.1
  Vinny Procopio 0.0% 3.2% 35.7% 45.2% 15.9% 11.6 10.5 1.1
Flight 2 Jon Carroll 0.0% 6.5% 35.9% 34.6% 22.9% 11.9 10.2 1.7
  Dale Russell 0.0% 3.3% 38.6% 36.6% 21.6% 11.4 11.5 (0.1)
  Brian Thompson 0.9% 8.5% 31.6% 33.3% 25.6% 12.4 11.3 1.1
  Mike Carroll 0.0% 4.3% 34.6% 39.5% 21.6% 11.3 10.9 0.4
  Tom Phillips 0.0% 3.5% 29.2% 44.4% 22.9% 10.5 10.3 0.2
  Sean Mott 0.0% 3.7% 30.2% 39.5% 26.5% 10.3 11.2 (0.9)
  Chris Donegan 0.0% 0.0% 25.3% 50.6% 24.1% 9.1 8.4 0.7
  Drew Prucha 0.0% 2.0% 23.5% 46.4% 28.1% 9.1 9.2 (0.1)
  Matt Lochner 0.0% 1.2% 23.5% 43.8% 31.5% 8.6 9.8 (1.2)
  Rick Fanto 0.0% 0.7% 22.2% 50.0% 27.1% 8.8 8.6 0.2
  Tony Massa 0.0% 1.9% 24.7% 39.5% 34.0% 8.7 7.3 1.4
  Marty Donegan 0.0% 1.2% 28.4% 35.8% 34.6% 8.8 8.3 0.5
Flight 3 Gary Thompson 0.0% 2.6% 20.3% 39.9% 37.3% 8.2 8.9 (0.7)
  Tom Donegan 0.0% 1.4% 16.7% 47.2% 34.7% 7.8 7.5 0.3
  Gary Antos 0.0% 1.3% 19.0% 41.8% 37.9% 7.6 7.3 0.3
  Denny Welch 0.7% 0.7% 16.3% 43.0% 39.3% 7.6 6.8 0.8
  Dan Mahar 0.0% 0.6% 16.7% 44.4% 38.3% 7.2 6.5 0.7
  Pat Cregg 0.0% 1.3% 21.6% 38.6% 38.6% 7.8 7.6 0.2
  Joe Donegan 0.0% 1.2% 16.0% 38.3% 44.4% 6.8 6.6 0.2
  Jim Morgan 0.0% 2.1% 19.4% 31.3% 47.2% 7.1 5.7 1.4
  Art Brillanti 0.0% 0.9% 15.4% 33.3% 50.4% 6.1 5.8 0.3
  Bob Moran 0.0% 1.3% 15.0% 28.8% 54.9% 5.8 3.3 2.5
  Bob Zaleski 0.0% 0.7% 11.1% 31.1% 57.0% 5.1 4.4 0.7
  Bill Kirkby 0.0% 0.0% 15.7% 31.5% 52.8% 5.7 2.6 3.1

Here’s a look at the same thing by Flight:

  Flight 1 Flight 2 Flight 3
Eagle % 0.1% 0.1% 0.1%
Birdie % 5.6% 3.1% 1.2%
Par % 43.8% 29.0% 16.9%
Bogey % 36.2% 41.2% 37.4%
No Pts % 14.4% 26.7% 44.4%
Average Round Points 13.2 10.1 6.9
Average Quota 12.3 9.8 6.1
Avg Flight Performance 0.9 0.3 0.8

2014 Averages

A few notes on the 2014 Averages…

The League on average shed roughly .85 strokes from its 18 hole round, so play was improved overall. 22 of 36 golfers improved on their 2013 campaigns. With the top two improvements coming from the champions, it goes to show that no matter what the scoring system is, you still need to shoot well!

A look at the cutlines between flights saw Marty Donegan comfortably into Flight 2 from Flight 3. An interesting situation occured that the Flight 1/Flight 2 cutline.

You might want to think twice about Gimmie putts the next time it still has some meat left on it. Every stroke matters! Had Jon Carroll use ONE less stroke in 2014, he would jump Vinny Procopio for the final Flight 1 spot. Jon would also have secured a Flight 1 spot of Vinny had added one stroke throught out the year or if DJ Mahar had added two strokes to his 2014 rounds.

Top 5 Stroke Improvements:

  1. Bobby Mo: -8.75
  2. DJ Mahar: -5.64
  3. Art Brillanti: -5.26
  4. Jon “My Lessons are Paying Off” Carroll: -4.10
  5. Tony Massa: -3.83

Top 5 Tough Seasons:

  1. Brian Thompson: +5.65
  2. Mike Carroll: +4.33
  3. Joe “Jaguar Steelz” Donegan: +4.14
  4. Jim “Sandbagger” Morgan: +2.58
  5. Matt Lochner: +1.72
      Front Back Change from 2013
Flight 1 Devin Carrigan 78.75 38.50 40.25
  Nick Wight 79.42 39.67 39.75 -0.96
  Pat Donahue 79.88 40.00 39.88 -0.98
  Connor Brown 80.67 41.44 39.22
  Dick Donegan 83.44 42.89 40.56 -1.19
  TJ Donegan 83.67 41.78 41.89 -1.11
  Jack Donegan 84.50 43.00 41.50 -0.88
  Craig Hawkinson 85.28 43.78 41.50 -0.74
  Steve Donegan 85.40 43.78 41.63 -0.26
  Bill John 85.83 42.33 43.50
  DJ Mahar 86.25 43.50 42.75 -5.64
  Vinny Procopio 86.29 42.00 44.29
Flight 2 Jon Carroll 86.38 44.38 42.00 -4.10
  Dale Russell 86.61 43.50 43.11 -2.68
  Brian Thompson 86.67 43.67 43.00 5.65
  Mike Carroll 87.00 44.22 42.78 4.33
  Tom Phillips 88.54 45.43 43.11 1.21
  Sean Mott 90.00 46.00 44.00 -2.11
  Chris Donegan 91.22 45.89 45.33 -0.40
  Drew Prucha 92.03 45.25 46.78 -0.13
  Matt Lochner 92.11 46.11 46.00 1.72
  Rick Fanto 92.67 47.00 45.67 0.83
  Tony Massa 93.44 47.67 45.78 -3.83
  Marty Donegan 93.56 47.44 46.11 -2.46
Flight 3 Gary Thompson 94.01 47.13 46.89 -0.27
  Tom Donegan 94.75 48.00 46.75 -3.23
  Gary Antos 95.94 48.50 47.44 1.56
  Denny Welch 96.09 48.71 47.38
  Dan Mahar 96.11 47.44 48.67 -0.25
  Pat Cregg 96.97 49.22 47.75 0.37
  Joe Donegan 98.56 47.56 51.00 4.14
  Jim Morgan 99.50 50.38 49.13 2.58
  Art Brillanti 100.24 50.57 49.67 -5.26
  Bob Moran 101.25 52.00 49.25 -8.75
  Bob Zaleski 104.80 53.43 51.38 -0.75
  Bill Kirkby 105.31 53.71 51.60 -2.48

Week 18 Results

Flight 1 Flight 3
Nick Wight BIR#11BIR#12 $     24 Bob Moran    $             –
Pat Donahue    $     –   Bob Zaleski    $             –
Brian Thompson    $     –   Bill Kirkby    $             –
Mike Carroll    $     –   Art Brillanti    $             –
Dick Donegan    $     –   Bill John    $             –
TJ Donegan BIR#17 $     12 Tony Massa    $             –
Jack Donegan    $     –   Tom Donegan    $             –
Steve Donegan    $     –   Jim Morgan BIR#13BIR#14 $           36
Craig Hawkinson    $     –   Pat Cregg    $             –
Tom Phillips    $     –   Dan Mahar    $             –
Devin Carrigan    $     –   Joe Donegan    $             –
Dale Russell    $     –   Marty Donegan    $             –
Flight 2
DJ Mahar    $     –   Gary Antos    $             –
Vinny Procopio    $     –   Matt Lochner    $             –
Gary Thompson    $     –   Drew Prucha    $             –
Rick Fanto    $     –   Jon Carroll    $             –
Denny Welch EAG#13 $     18 Sean Mott    $             –
Connor Brown PAR#11 $     18 Chris Donegan    $             –
Player Quota Pts Pts. % Wins Loses Ties Win % Skins Winnings
Nick Wight 15 29 85.3% 14 2 1 82.4% 13 160
Connor Brown 14 26 72.2% 12 4 2 66.7% 9 97
Bill Kirkby 4 19 67.9% 8 3 3 57.1% 0 0
Bill John 12 22 64.7% 10 5 2 58.8% 17 212
Drew Prucha 9 22 61.1% 10 6 2 55.6% 4 30
Tony Massa 9 22 61.1% 10 6 2 55.6% 7 87
Rick Fanto 9 20 58.8% 9 6 2 52.9% 1 7
Jon Carroll 12 20 58.8% 9 6 2 52.9% 9 107
Dick Donegan 13 21 58.3% 10 7 1 55.6% 5 44
Devin Carrigan 15 21 58.3% 9 6 3 50.0% 10 90
Bob Moran 6 19 55.9% 8 6 3 47.1% 3 30
Bob Zaleski 4 16 53.3% 6 5 4 40.0% 1 12
Jim Morgan 6 17 53.1% 8 7 1 50.0% 6 79
Tom Phillips 11 18 52.9% 8 7 2 47.1% 2 24
Vinny Procopio 12 18 52.9% 8 7 2 47.1% 8 62
Craig Hawkinson 12 19 52.8% 8 7 3 44.4% 3 19
Joe Donegan 7 19 52.8% 7 6 5 38.9% 3 25
Sean Mott 10 19 52.8% 9 8 1 50.0% 8 110
Pat Donahue 14 18 50.0% 7 7 4 38.9% 10 137
Brian Thompson 12 15 50.0% 6 6 3 40.0% 4 61
Dan Mahar 8 17 47.2% 7 8 3 38.9% 5 55
Tom Donegan 8 16 47.1% 6 7 4 35.3% 2 24
Denny Welch 8 14 46.7% 7 8 0 46.7% 3 34
Mike Carroll 11 15 41.7% 6 9 3 33.3% 3 20
TJ Donegan 13 15 41.7% 7 10 1 38.9% 4 34
DJ Mahar 12 14 41.2% 6 9 2 35.3% 4 54
Steve Donegan 12 13 38.2% 5 9 3 29.4% 4 32
Art Brillanti 6 11 36.7% 4 8 3 26.7% 1 12
Gary Thompson 9 13 36.1% 5 10 3 27.8% 3 43
Marty Donegan 9 13 36.1% 6 11 1 33.3% 6 81
Chris Donegan 10 13 36.1% 5 10 3 27.8% 0 0
Matt Lochner 9 13 36.1% 6 11 1 33.3% 2 54
Gary Antos 8 12 35.3% 5 10 2 29.4% 2 11
Pat Cregg 7 12 35.3% 5 10 2 29.4% 3 30
Dale Russell 12 11 30.6% 3 10 5 16.7% 1 6
Jack Donegan 12 9 30.0% 3 9 3 20.0% 1 18

TBO 2014 is in the books!

Congratulations to the winners – Nick Wight, DJ Mahar, and Bob Moran. A little season recap for the winners…

DJ started off as one of the hotter golfers this year racking up the points in Weeks 1-5, going 4-0-1. As the golf gods giveth, the golf gods taketh away. After a sub in Week 6 (who lost), DJ saw his average go to a 44 from a 41 and a record of 1-8. He was able to right the ship in the end, going 1-1-1 and averaging a 42 over the final 3 weeks. His critical win in Week 17 helped vault his team to the top of the leaderboard. A real testament to not throwing in the towel after a tough spell

Bobby Mo’s season followed a similar trajectory. Bobby started the first half of the year 5-1-2. However, his early successes were followed by 1-5-1 stretch. Bob’s average over these two seperate stretches is the same, so it was a case of the Quota system correcting itself. Like DJ, Bob was able to adjust in the end and get two wins in the final two weeks, with a critical 46 in the final week.

While Bobby and DJ certainly were critical down the stretch, neither of them would have been in this position had it not been for the play of Nick Wight. Nick had a season for the record books. Nick’s season started rocky. Week 1 was played later in the year, so Week 2-4 saw Nick start 0-2-1. After that, Nick never looked back. He set a TBO record by winning 14 STRAIGHT matches (Old record of 10), never losing or tying for the rest of the season. If you include his Week 1 makeup which was played during that time, his win streak is actually 15. Nick tied the record for most wins in a season with a 14-2-1 mark (Sean Mott in 2009 was 14-1-2, Mike Carroll was 14-3-1 in 2010). He also tied Sean’s 2009 record mark for Win % with 82.4%.

The Standings page is updated to reflect Week 18 and a few more updates are coming!

Nerd

Individual Averages thru Week 17

Here’s what player’s averages are through Week 17. Some quick highlights:

Top 3 improvements:

  1. Bobby Moran – Shaved 8.29 strokes off of his average! That’s roughly a stroke a hole. Impressive by any measure!
  2. DJ Mahar – Cut 5.39 strokes off his average to take a tentative leap into Flight 1 and a shot at the title
  3. Art Brillanti – Shaved 5.26 strokes off his average.
      Front Back Change from 2013
Flight 1 Devin Carrigan 78.75 38.50 40.25 N/A
  Pat Donahue 79.88 40.00 39.88 -0.98
  Nick Wight 80.10 39.67 40.43 -0.29
  Connor Brown 80.82 41.44 39.38 N/A
  Dick Donegan 83.51 42.89 40.63 -1.12
  TJ Donegan 84.03 41.78 42.25 -0.75
  Jack Donegan 84.50 43.00 41.50 -0.88
  Craig Hawkinson 85.28 43.78 41.50 -0.74
  Steve Donegan 85.49 43.78 41.71 -0.17
  Brian Thompson 86.33 43.67 42.67 5.32
  Bill John 86.48 42.33 44.14 N/A
  DJ Mahar 86.50 43.50 43.00 -5.39
Flight 2 Vinny Procopio 86.50 42.00 44.50 N/A
  Dale Russell 86.63 43.50 43.13 -2.67
  Jon Carroll 86.63 44.38 42.25 -3.85
  Mike Carroll 87.47 44.22 43.25 4.80
  Tom Phillips 88.18 45.43 42.75 0.85
  Sean Mott 90.38 46.00 44.38 -1.74
  Chris Donegan 90.89 45.89 45.00 -0.73
  Drew Prucha 91.88 45.25 46.63 -0.29
  Matt Lochner 92.11 46.11 46.00 1.72
  Rick Fanto 92.75 47.00 45.75 0.92
  Tony Massa 93.04 47.67 45.38 -4.23
  Marty Donegan 93.69 47.44 46.25 -2.32
Flight 3 Gary Thompson 94.00 47.13 46.88 -0.29
  Tom Donegan 95.00 48.00 47.00 -2.98
  Gary Antos 95.88 48.50 47.38 1.49
  Dan Mahar 96.19 47.44 48.75 -0.17
  Pat Cregg 96.22 49.22 47.00 -0.38
  Denny Welch 97.14 48.71 48.43 N/A
  Joe Donegan 99.56 47.56 52.00 5.14
  Art Brillanti 100.24 50.57 49.67 -5.26
  Jim Morgan 100.38 50.38 50.00 3.45
  Bob Moran 101.71 52.00 49.71 -8.29
  Bob Zaleski 104.80 53.43 51.38 -0.75
  Bill Kirkby 105.31 53.71 51.60 -2.48

Week 17 updated, Week 16 Flight 2 Skins

After an interesting Week 17 that saw the leaders drop, time to head into the home stretch. Mathematically speaking, there are only two teams that have a shot of winning the title. Nick, DJ and Bobby Mo have a 1.5 pt lead and will square off against TJ, Connor and Tony Massa. Despite T-Bird, Jon and Dan Mahar’s best effort and even if they get 7 pts in Week 18, they would fall short by HALF A POINT in various scenarios. Just imagine if one of the guys on that team turned one of their five 1 pt losses into a tie…Every week, every match matters!

Before getting into Week 17, here’s the skins for Flight 2 from Week 16.

Flight 2
DJ Mahar BIR#18 $     18 Gary Antos    $             –
Vinny Procopio    $     –   Matt Lochner    $             –
Gary Thompson BIR#11 $     18 Drew Prucha    $             –
Rick Fanto    $     –   Jon Carroll    $             –
Denny Welch    $     –   Sean Mott    $             –
Connor Brown    $     –   Chris Donegan    $             –


On to Week 17 results…

Flight 1 Flight 3
Nick Wight    $     –   Bob Moran    $             –
Pat Donahue    $     –   Bob Zaleski    $             –
Brian Thompson    $     –   Bill Kirkby    $             –
Mike Carroll    $     –   Art Brillanti    $             –
Dick Donegan    $     –   Bill John    $             –
TJ Donegan    $     –   Tony Massa    $             –
Jack Donegan BIR#5 $     18 Tom Donegan    $             –
Steve Donegan    $     –   Jim Morgan PAR#3PAR#5 $           18
Craig Hawkinson    $     –   Pat Cregg PAR#4 $             9
Tom Phillips    $     –   Dan Mahar PAR#9 $             9
Devin Carrigan EAG#2 $     18 Joe Donegan    $             –
Dale Russell    $     –   Marty Donegan    $             –
Flight 2
DJ Mahar    $     –   Gary Antos    $             –
Vinny Procopio    $     –   Matt Lochner    $             –
Gary Thompson BIR#7 $       7 Drew Prucha    $             –
Rick Fanto BIR#5 $       7 Jon Carroll BIR#9 $             7
Denny Welch BIR#4 $       7 Sean Mott    $             –
Connor Brown PAR#3 $       7 Chris Donegan    $             –

Week 18 Schedule:

Week 18
Nick Wight 14 VS 13 TJ Donegan
DJ Mahar 12 VS 14 Connor Brown
Bob Moran 5 VS 9 Tony Massa
Tom Phillips 11 VS 13 Dick Donegan
Jon Carroll 12 VS 7 Denny Welch
Dan Mahar 8 VS 12 Bill John
Devin Carrigan 15 VS 14 Pat Donahue
Sean Mott 10 VS 12 Vinny Procopio
Joe Donegan 7 VS 4 Bob Zaleski
Craig Hawkinson 12 VS 12 Brian Thompson
Drew Prucha 10 VS 9 Gary Thompson
Pat Cregg 8 VS 4 Bill Kirkby
Steve Donegan 12 VS 11 Mike Carroll
Matt Lochner 9 VS 9 Rick Fanto
Jim Morgan 6 VS 6 Art Brillanti
Jack Donegan 12 VS 12 Dale Russell
Gary Antos 8 VS 10 Chris Donegan
Tom Donegan 8 VS 9 Marty Donegan

Nerd

Week 16 Standings, Skins for Flight two still outstanding

Standings page is updated with the scores from Week 16. Note there is only one match still outstanding (Chris vs. Matt Lochner). That match will be made up prior to the start of play for Week 17.

Flight 1 Flight 3
Nick Wight BIR#10 $     36 Bob Moran    $             –
Pat Donahue    $     –   Bob Zaleski    $             –
Brian Thompson    $     –   Bill Kirkby    $             –
Mike Carroll    $     –   Art Brillanti    $             –
Dick Donegan    $     –   Bill John    $             –
TJ Donegan    $     –   Tony Massa PAR#10 $           18
Jack Donegan    $     –   Tom Donegan    $             –
Steve Donegan    $     –   Jim Morgan PAR#15 $           18
Craig Hawkinson    $     –   Pat Cregg    $             –
Tom Phillips    $     –   Dan Mahar    $             –
Devin Carrigan    $     –   Joe Donegan    $             –
Dale Russell    $     –   Marty Donegan    $             –

As for the standings, it looks to be TJ/Connor/Tony’s title to lose.

Team Standings Pts Pts Back
TJ Donegan Connor Brown Tony Massa 70                –  
Nick Wight DJ Mahar Bob Moran 65.5            (4.5)
Pat Donahue Vinny Procopio Bob Zaleski 62.5            (7.5)
Dick Donegan Denny Welch Bill John 61            (9.0)
Tom Phillips Jon Carroll Dan Mahar 61            (9.0)
Craig Hawkinson Drew Prucha Pat Cregg 61            (9.0)


For the three teams at 9 points back, they need two things to happen. The top team to get anywhere from 0-2 pts AND need to get 7 points from their matches. Not an impossibility, but certainly a long shot. Same can be said for the folks at 7.5 points back. Might not need to get 7, but certainly need to get the top team stumble and 6 points. The team in second place needs to gain about a point or two to make Position Night interesting.


To give those teams chasing the leader a little ray of hope…Connor and Devin pre-played their Week 17 match. Devin was +6, Connor was 0. Leaders have had a slight stumble, are they ready for a fall this week?


Schedule for Week 17

Week 17
Sean Mott 10 VS 9 Tony Massa
Devin Carrigan 15 VS 14 Connor Brown
Joe Donegan 6 VS 13 TJ Donegan
Chris Donegan 10 VS 5 Bob Moran
Dale Russell 12 VS 12 DJ Mahar
Marty Donegan 9 VS 14 Nick Wight
Jon Carroll 11 VS 8 Tom Donegan
Tom Phillips 11 VS 8 Gary Antos
Dan Mahar 8 VS 12 Jack Donegan
Vinny Procopio 12 VS 12 Bill John
Pat Donahue 14 VS 7 Denny Welch
Bob Zaleski 5 VS 13 Dick Donegan
Rick Fanto 9 VS 6 Jim Morgan
Mike Carroll 11 VS 9 Matt Lochner
Art Brillanti 6 VS 12 Steve Donegan
Gary Thompson 8 VS 7 Pat Cregg
Brian Thompson 12 VS 10 Drew Prucha
Bill Kirkby 4 VS 12 Craig Hawkinson

Nerd